
Power BI Dashboard Development Services: Pricing and Delivery Timeline Explained
Explore BI dashboard development services, including typical pricing, development timelines, key factors affecting costs, and what businesses should expect during the delivery process.
24
Sep
Power BI Dashboard Development Services: Pricing and Delivery Timeline Explained
Published 24 Sep 2026 Updated 24 Sep 2026 Written and reviewed by Anshul Goyal
Table of Contents
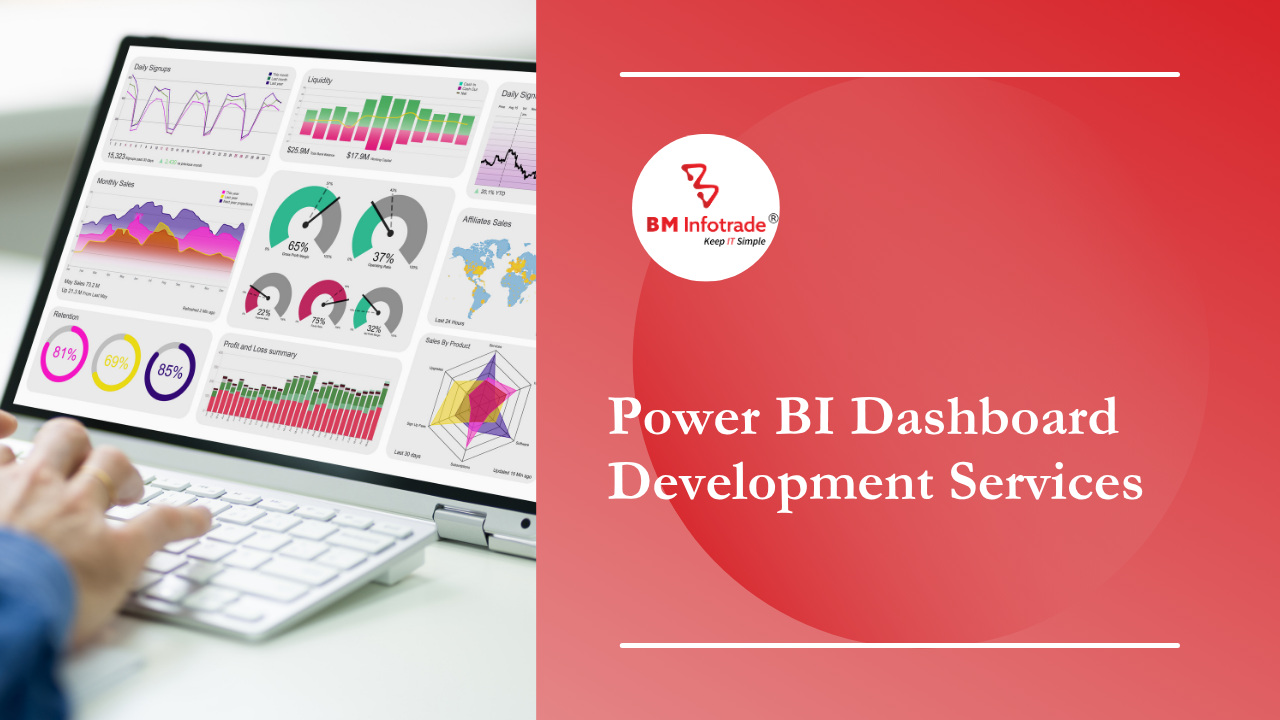
BI dashboard development services assist companies in transforming their data from multiple sources such as spreadsheets, CRM, accounting, ERP, and more into dynamic and clear reports.
A simple dashboard can cost between $3,000 and $8,000 and can take around 2 to 4 weeks to develop. A collection of dashboards can cost from $8,000 to $30,000, and an enterprise business solution can cost more than $100,000.
Complexity and quality of data, the number of system connections or integrations, security, KPIs, and the range of dashboards or the BI platform the client selects can impact the final cost.
What Are BI Dashboard Development Services?
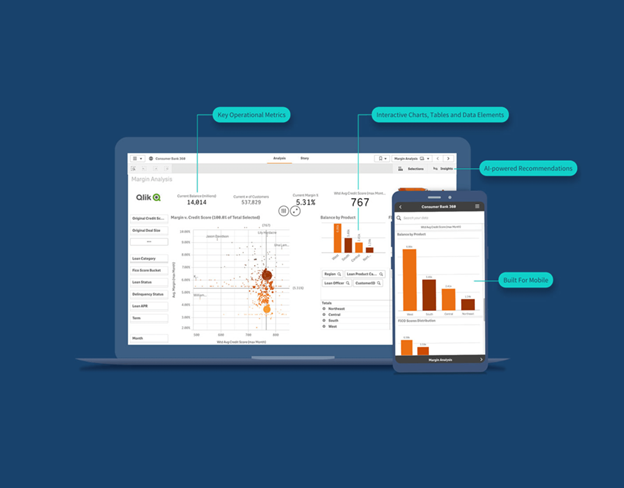
The creation of a BI dashboard involves the collection, cleansing, and organisation of business data, as well as the creation of interactive data displays.
The following are usually offered as part of dashboard development service packages:
-
1. Analysis of business requirements
-
2. Definition of key performance indicators (KPIs)
-
3. Evaluation of potential data sources
-
4. Data cleansing
-
5. Data integration
-
6. Design of the dashboard
-
7. Data modeling
-
8. Establishment of automated dashboard refresh
-
9. Configuration of security settings
-
10. Testing and deployment
-
11. Training of end users
-
12. Provision of post-deployment support
An accurate, secure and useful professional dashboard develops data and presents it in a way that allows business managers to make more informed decisions.
A sales dashboard could include data on sales revenue, sales targets, sales conversion data and sales performance by region. A finance dashboard could capture data on cash flow, business expenses, profit margins and budget variances.
BI Dashboard Development Cost
The cost of BI dashboard development depends on the size and complexity of the project.
|
Project Type |
Estimated Cost |
Delivery Time |
|
Dashboard prototype |
$1,500–$4,000 |
1–2 weeks |
|
Basic dashboard |
$3,000–$8,000 |
2–4 weeks |
|
Multi-dashboard solution |
$8,000–$30,000 |
4–8 weeks |
|
Advanced analytics solution |
$25,000–$60,000 |
6–14 weeks |
|
Enterprise BI implementation |
$30,000–$100,000+ |
8–20+ weeks |
A single dashboard, one or two tidy data sources and typical business KPIs are usually what is included in a basic dashboard.
More complex projects may involve several departments, automated data pipelines, data accessibility and permissions, custom business calculations, custom-built cloud infrastructure, and a central data warehouse.
These price ranges are helpful for preliminary planning. A final quotation should only be prepared after data sources are reviewed and business requirements are analysed.
Factors That Affect Dashboard Pricing
How Many Ways to Download Data?
The number of available data sources constrains how the dashboard can be developed, limiting how the dashboard can be used.
Combining data from:
-
1. Salesforce
-
2. SAP
-
3. QuickBooks
-
4. Google Analytics
-
5. Various spreadsheets
-
6. Advertising platforms
-
7. E-commerce
-
8. Custom programs
Data Integration, data validation and data verification must all be done for every new data source.
How Reliable is the Data?
If the data quality is bad, the project cannot be done for the estimated budget.
Bad data typically has:
-
1. Missing or extra data
-
2. Various data formats
-
3. Incorrect or inconsistent calculations
-
4. Informulas
-
5. Data that is owned by no one
Cleaning the data can take longer than designing the dashboard. Because of this, the data needs to be audited before the project budget is set.
Value of KPIs
Calculating basic KPIs such as revenue or profit or counting orders is easy.
The value of other KPIs can be harder to measure and require more time to develop.
Things like:
-
1. Customer value
-
2. Customer churn
-
3. Contribution margin
-
4. Retention
-
5. Forecasts
-
6. Budgets
-
7. Profitability in multiple currencies
Before presenting a dashboard, all KPIs should have a value and a data source.
Scope of Dashboard
Cost associated with a dashboard includes the number of user roles, dashboards, pages, filters and drill-downs.
Costs also include:
-
1. The ability to view pages designed for different roles
-
2. The ability to view reports for different departments
-
3. The ability to view different filters
-
4. The ability to drill down to other report pages
-
5. The ability to export data
-
6. Alerts that can be customised to be sent automatically
-
7. A layout that is designed to be viewed on a mobile device.
Costs do not include the number of charts. A dashboard with many simple charts can have easily more work than a dashboard with few complex charts.
Security
If sensitive data is used, constructors can expect to pay extra for some features like:
-
1. Security that allows different roles to see different data
-
2. Security that allows each user to see different data
-
3. Data that is unclassified
-
4. Private connections to the developer's network
-
5. Security should be designed first rather than added later.
BI Dashboard Development Timeline
Most dashboard projects take between two and eight weeks. Enterprise implementations may take several months.
|
Development Stage |
Estimated Duration |
|
Requirement and KPI planning |
2–5 days |
|
Data audit |
3–10 days |
|
Dashboard wireframe |
3–7 days |
|
Data integration and modelling |
1–4 weeks |
|
Dashboard development |
1–4 weeks |
|
Testing and deployment |
1–2 weeks |
Expansion of the project timeline may occur under the following circumstances:
-
1. Inefficient data
-
2. Delayed access to systems
-
3. Unclear definitions of KPIs
-
4. Involvement of different divisions
-
5. Time-consuming security approvals
-
6. Frequent changes to project scope
Setting requirements clearly and improving the speed of stakeholder feedback are the most effective strategies to reduce delays.
Power BI, Tableau or Custom Dashboard?
1. Power BI
Power BI is typically used by firms that have implemented Microsoft 365, Azure or Excel.
It is designed for use in operational reports, financial dashboards, and department analytics.
2. Tableau
Tableau specialises in the visual analysis of data and the creation of interactivity among the detailed data.
It is the choice of firms that require the use of sophisticated visualisation and self-service reporting.
3. Looker
Looker fits the needs of firms that require consistent and centrally endorsed KPIs throughout various divisions.
It can also be an excellent fit for cloud-centric firms that have a robust data warehousing practice.
4. Custom Dashboard
A custom dashboard is required if the analytics have to be embedded in a:
-
1. SaaS product
-
2. Customer portal
-
3. Mobile app
-
4. Internal business system
-
5. Partner platform
Custom dashboards are more flexible, but typically come with a greater cost for development and ongoing maintenance.
Costs for the platform, cloud hosting, connectors, and support and integration will be in addition to the development costs.
How to Reduce Development Costs
Businesses can save on dashboard development by managing their project scope at the right time.
Start with only the most critical KPIs rather than the full list of dashboard reports requested.
Additional methods to save on costs involve:
-
1. Source data is cleaned before dashboard development
-
2. Current reports and data spreadsheets are provided
-
3. KPI formulas are locked in
-
4. Wireframes of dashboards are approved before
-
5. development of dashboards
-
6. Cut back on the number of revisions
-
7. Distinguish between what is necessary and what is preferred
-
8. Data models that have already been developed are used again (are put to use)
-
9. Phase the project
A business can implement a larger analytics platform around its dashboard after it employs a minimum viable dashboard to test the level of adoption and use.
Frequently Asked Questions
1. What is the price of a BI dashboard?
A BI dashboard typically costs between $3,000 and $8,000. Multi-dashboard solutions usually fall between $8,000 and $30,000. Enterprise BI solutions generally cost $100,000 and above.
2. What is the standard timeline for development?
Simple dashboards usually take two to four weeks. Complex dashboard solutions that integrate multiple systems, include advanced analytics and complex security requirements take eight to twenty weeks and may take longer.
3. What takes the most of the development budget?
Preparing and integrating data is usually the most expensive part of the budget, especially when data is unstructured or dispersed across multiple systems.
4. Are BI platform subscriptions included in the cost?
Subscriptions for platforms, cloud hosting, data connectors and application support are typically charged in addition to dashboard development.
5. Can BI dashboard design be based on Excel reports?
Yes. Reports from Excel can be used to design dashboards in Power BI, Tableau, Looker, as well as other custom BI dashboards. Review of the data quality and data structure, as well as the formulas, is recommended before design.
Conclusion
The cost of developing a BI dashboard can be in the thousands for a basic dashboard and go up to over $100,000 for an enterprise dashboard. Average costs are typically lower for visually complex dashboards as data builds up costs. The quality of data and the complexity of integrations, as well as underspecified or overly complex KPIs, security, costs of dashboard refresh, and end-user needs, all affect the costs and the time to develop the dashboard.
Businesses are advised to carry out a data audit before developing a dashboard, define KPIs, and develop the dashboard in phases. This process helps to manage costs and delays, and develop a dashboard that helps inform business decisions.




Anshul Goyal
Group BDM at B M Infotrade | 11+ years Experience | Business Consultancy | Providing solutions in Cyber Security, Data Analytics, Cloud Computing, Digitization, Data and AI | IT Sales Leader