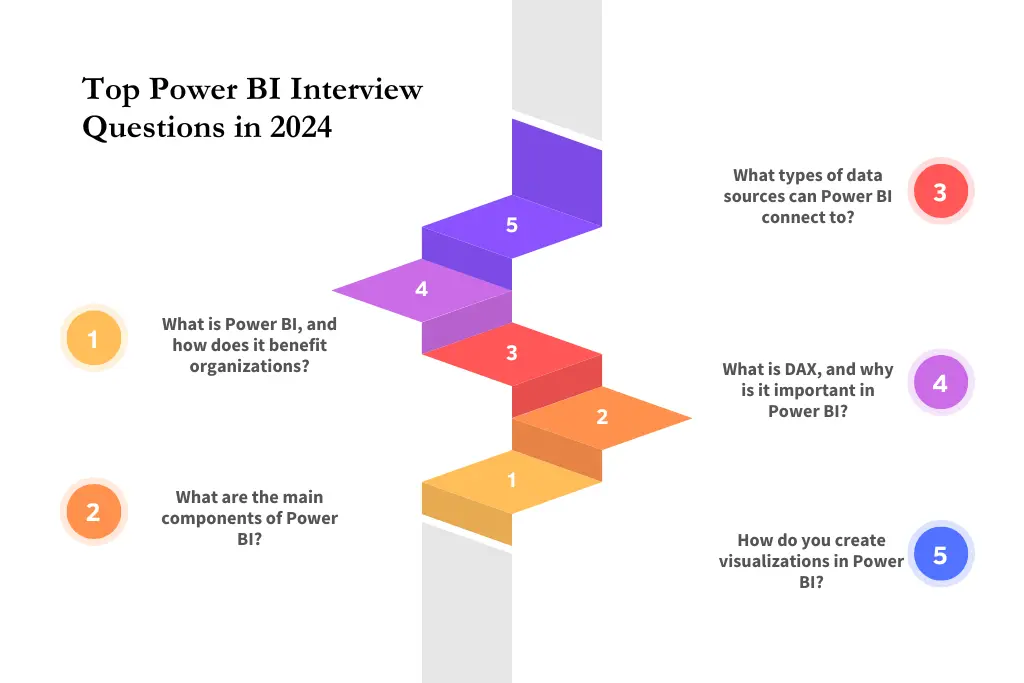
Top Power BI Interview Questions in 2024
Get ready for your Power BI interview with these essential questions and answers tailored for 2024.

06
Feb
Top Power BI Interview Questions in 2024
Table of Contents
- Introduction
- Why Prepare for Power BI Interviews?
- General Tips for Power BI Interviews
- Power BI interview questions for freshers
- Data Loading and Transformation
- Data Modeling
- Visualization and Reporting
- DAX (Data Analysis Expressions)
- Power BI scenario-based interview questions and answers
- Power Query M Language
- Power BI Service and Power BI Gateway
- Power BI Premium Features
- Troubleshooting and Optimization
- Soft Skills for Power BI Professionals
- Problem-solving abilities
- Adaptability and continuous learning
- Finance and Banking
- Healthcare and Pharmaceuticals
- Retail and E-commerce
- Manufacturing and Supply Chain
- In summary
Introduction
Within the ever-changing field of data analytics, Power BI has become an indispensable resource for professionals looking to use data to make well-informed decisions. For those hoping to succeed in the field, Power BI Interview Questions preparation is crucial as the need for qualified Power BI analysts grows.
Why Prepare for Power BI Interviews?
A thorough understanding of Power BI is extremely beneficial in the competitive work market. Professionals with Power BI abilities find themselves at the vanguard of career prospects and advancements, as businesses increasingly depend on data-driven insights.
General Tips for Power BI Interviews
Comprehending the fundamentals is the cornerstone to triumphing in any Power BI interview. Understanding every feature of Power BI is crucial, from data loading to visualisation. To stand out, keep up with the newest features and use projects to highlight your real-world experience.

Read more: What is Power BI: Microsoft's Data Visualization Tool
Power BI interview questions for freshers
Data Loading and Transformation
1. How do you handle large datasets in Power BI?
Handling large datasets in Power BI requires careful consideration to ensure optimal performance. Here are some strategies:
- Data Import Optimization: Import only the necessary columns and rows to reduce the dataset size.
- Data Filtering: Use filters to load a subset of data initially and progressively load more as needed.
- Data Aggregation: Summarize or aggregate data before importing to reduce the volume of records.
- Data Partitioning: Divide large datasets into smaller partitions for more efficient processing.
- Use of Power BI Features: Leverage features like Data Analysis Expressions (DAX) for complex calculations, and utilize Power Query Editor for data transformations
2. Explain the importance of data profiling in Power BI.
One of the most important steps in figuring out the qualities and features of your data is data profiling. It's important in Power BI for a few reasons:
- Finding Data Issues: To ensure data accuracy, data profiling assists in locating anomalies, missing values, and outliers in the dataset.
- Understanding Data Distribution: Profiling helps with efficient data modelling and visualisation by displaying the distribution of values inside each column.
- Quality Assessment: You can evaluate the dataset's quality and, if necessary, take remedial action by looking at data patterns.
- Improving Data Transformation: By offering insights into required adjustments or cleaning procedures, profiling directs the transformation process.
- Data Exploration: By providing a summary of important information, profiling aids in data exploration and empowers users to decide how best to handle data.
Data Modeling
3. What is star schema, and how is it used in Power BI?
The primary fact table is linked to dimension tables via one-to-many relationships in Power BI's "star schema" form of data modeling. The essential elements consist of:
- Fact Table: The primary data you wish to examine is contained in the fact table (e.g., sales, revenue).
- Dimension Tables: Include attributes (such as date, product, and location) that are descriptive of the data in the fact table.
- Relationships: The fact table and dimension tables establish one-to-many relationships.
- Performance and Simplicity: The star structure facilitates effective data retrieval, improves performance, and simplifies queries.
- Effective Visualisation: By allowing users to generate aesthetically pleasing and perceptive reports based on structured relationships, Power BI leverages the advantages of the star schema.
Visualization and Reporting
4. Describe the process of creating a custom visualization in Power BI.
To create a personalised Power BI visualisation, you need to take subsequent actions:
- Data Preparation: Make sure your data is organised properly and includes all the details required for the unique visualisation.
- Power BI Desktop: Launch Power BI Desktop, then fill the model with your data. Open the "Visualizations" window.
- Import the Custom Visualization: In the "Visualizations" tab, select the "Import a custom visualisation" icon (three squares). Choose the custom visualisation file you wish to utilise, which is often in the.pbiviz format.
- Setting Up Custom Visualization: Drag and drop the relevant fields from your dataset into the custom visualization's fields. Set up properties for colours, labels, and other visual elements.
- Preview and Refinement: See how your personalised visualisation appears with the real data by using the preview tool. Make any necessary changes to polish the look and make sure it successfully communicates insights.
- Save and Publish: If required, save your Power BI report after you're happy with the custom visualisation and publish it to the Power BI service.
DAX (Data Analysis Expressions)
5. What is the difference between CALCULATE and CALCULATETABLE in DAX?
The functions CALCULATE and CALCULATETABLE in DAX (Data Analysis Expressions) are useful for adjusting and managing context when evaluating expressions. But they have different functions:
CALCULATE:
- Purpose: Its multipurpose role is meant to assess expressions inside a context that has been altered by filters.
- Usage: To modify or override the current computation context, enclose expressions in CALCULATE. Applying filters and conditions to the data being analysed is a popular usage for it.
- Example: CALCULATE(SUM(Sales), ProductCategory = "Electronics") determines the total sales for the Electronics category.
CALCULATETABLE:
- Purpose: It gives you the ability to filter tables and manipulate them in a way that changes the context.
- Use: This is used when working with table expressions as opposed to scalar values. When working with table functions like values or filters, it may be helpful.
- Example: CALCULATETABLE(Sales, Dates[Year] = 2024) computes the sales table by taking into account only the information for the year 2024.
Power BI scenario-based interview questions and answers
Power Query M Language
6. How can you use Power Query M Language for advanced data transformations?
One of Power BI's most useful tools for modifying and changing data is Power Query M Language. For more complex conversions, you can use it for:
- Custom Functions: To capture intricate transformations, create custom functions in the M Language. This makes the transformation process easier overall and improves reusability.
- Conditional Logic: To handle various circumstances during data transformation, use the if-then-else conditions in the M Language. This enables you to apply particular changes according to particular standards.
- Data Types and Structures: To guarantee accuracy and consistency in your modified dataset, define and work with data types and structures using the M Language.
- Advanced Filtering and Sorting: Use M Language's advanced filtering and sorting methods to extract particular data subsets and organise them as needed.
Power BI Service and Power BI Gateway
7. Explain the role of Power BI Gateway in the Power BI ecosystem.
Between on-premises data sources and the cloud-based Power BI Service, Power BI Gateway serves as a bridge. Among its principal functions are:
- Data Refresh: The Power BI Service's on-premises data can be refreshed thanks to the Power BI Gateway. By routinely extracting data from multiple sources, it guarantees that datasets remain current.
- Secure Connection: To preserve data integrity and confidentiality, the gateway creates a secure connection between on-premises data sources and the Power BI Service.
- Scheduled Data Updates: To enable frequent and timely refreshes, users can plan when data from on-premises sources should be updated in the Power BI Service.
- Live Connection: Real-time data access and analysis are made possible by Power BI Gateway's support for live connections to on-premises data, which eliminates the need to import data into the Power BI cloud.
Power BI Premium Features
8. What are the advantages of using Power BI Premium over Power BI Pro?
When compared to Power BI Pro, Power BI Premium has the following benefits:
- Dedicated Resources: Power BI Premium comes with dedicated resources, so even at periods of high usage, performance is constant and dependable. This is essential for big businesses that require a lot of data.
- Advanced Analytics: Premium gives businesses access to cutting-edge analytics capabilities like artificial intelligence and machine learning, enabling them to extract more meaningful information from their data.
- On-premises Reporting: By enabling the on-premises deployment of Power BI Reports with Power BI Premium, enterprises may improve sensitive data protection and compliance.
- Concurrency and Parallel Query Execution: Higher levels of concurrency and parallel query execution are possible with Premium, allowing for quicker and more effective data processing.
Troubleshooting and Optimization
9. How do you optimize a Power BI report for faster performance?
A Power BI report can be made to operate more quickly by using the following strategies:
- Data Model Simplification: To improve processing speed, remove extraneous tables and columns from your data model.
- Indexing: To expedite data retrieval and aggregation, properly index the data model.
- Aggregation Tables: To reduce the effort during queries, create summary tables or aggregations to precalculate and save summarised data.
- Query Folding: Encourage query folding whenever you can, as it minimises data transport by enabling Power BI to push processes back to the data source.
- Data compression: To minimise the total amount of your dataset and expedite data loading and visualisation, optimise the types of data you have and make use of compression techniques.
- Use of Relationships: construct effective relationships between tables, being sure to construct relationships only when required to prevent needless calculation.
Soft Skills for Power BI Professionals
Communication skills
10. How do you explain complex data insights to non-technical stakeholders?
Make Use of Simple Words:
- Translate technical jargon into phrases that are easy to understand.
- Steer clear of technical jargon that could confuse stakeholders who aren't technical.
Visual Supports:
- Employ visual aids such as graphs and charts to illustrate data trends.
- Text cannot always convey information as swiftly or clearly as images can.
Method of Storytelling:
- Make data insights approachable by weaving them into a story.
- Make connections between data points and actual situations to improve understanding.
Engaging Talks:
- Let stakeholders interact with the data to increase their level of engagement.
- Make use of resources that enable practical insight discovery.
Address the main issues:
- Be proactive in responding to queries and worries by anticipating them.
- Adjust explanations to the priorities of stakeholders.
Promote Inquiries:
- Encourage open communication by posing queries and starting conversations.
- Assure a common understanding by swiftly clearing up any questions.
Problem-solving abilities
11. Share an instance where you faced challenges in a Power BI project and how you resolved them.
We ran into a data integration problem in a difficult Power BI project where distinct datasets from various sources had inconsistent formats. This presented a major challenge to producing a cohesive report. I put in place a thorough data profiling procedure to handle this, finding abnormalities and discrepancies. I ensured consistency by applying standardised data cleansing approaches using Power Query's transformation features. In addition, I worked closely with the owners of the data sources to optimise the data extraction procedure. This improved overall data quality in addition to resolving the formatting issues. My ability to solve problems was demonstrated by the successful resolution, which also highlighted the value of clear communication in resolving challenging issues inside the Power BI framework.
Adaptability and continuous learning
12. How do you stay updated with the latest trends and updates in Power BI?
To guarantee ongoing education and flexibility, I utilise a diverse strategy:
- Subscribe to Official Channels: I can make sure that I learn about new features, upgrades, and best practices directly from the source by routinely subscribing to official Power BI channels, like the Power BI blog and Microsoft's official documentation.
- Participate in Online Communities: I may access the community's collective expertise by actively participating in Power BI-related forums, discussion groups, and online communities.
- Follow Thinking Leaders: One proactive approach to getting real-time updates on social media sites like Twitter and LinkedIn is to find and follow experts and thinking leaders in the Power BI community.
- Attend Webinars and Conferences: I stay educated by routinely going to webinars, online conferences, and workshops offered by Microsoft and other respectable companies.
Industry-Specific Power BI Interview Questions
Finance and Banking
13. How can Power BI be utilized in financial forecasting?
- Making Use of Historical Data: Power BI can make use of past financial data to spot patterns and trends that lay the groundwork for precise forecasting.
- Dynamic Dashboards: Financial analysts can monitor real-time data and quickly modify estimates in response to changes in the market by creating dynamic dashboards in Power BI.
- Scenario Analysis: Financial experts can evaluate the effects of different financial situations on predicting results by using Power BI's scenario analysis feature.
- Integration with External Data Sources: The precision of financial forecasting is improved by Power BI's integration with external data sources, including market indexes and economic indicators.
- Predictive Analytics: Financial forecasting can be further improved by utilising machine learning models in Power BI to anticipate future trends based on past performance.
Healthcare and Pharmaceuticals
14. Discuss the role of Power BI in healthcare analytics.
This is a succinct summary of its importance:
Consolidation and Integration of Data
- Patient records, test results, and operational data are just a few of the healthcare datasets that can be seamlessly integrated with Power BI.
- brings together data from multiple sources to provide a cohesive picture for improved decision-making.
Monitoring and Reporting in Real Time
- permits the real-time tracking of resource usage, treatment effectiveness, and patient outcomes.
- produces immediate reports to help medical practitioners make well-informed decisions promptly.
KPIs and Performance Metrics
- aids in the definition and monitoring of key performance indicators (KPIs), including readmission rates, patient wait times, and the effectiveness of resource use.
- enables the ongoing enhancement of medical services through insights derived from data.
Predictive Analytics for Patient Care
- makes use of predictive modelling to predict future trends in healthcare as well as illness outbreaks and patient admission rates.
- permits preemptive actions for improved patient care planning and resource allocation.
Regulatory Reporting and Compliance
- helps to ensure adherence to healthcare laws by automating the generation of reports.
- simplifies the reporting procedure while guaranteeing precision and compliance with industry norms.
Retail and E-commerce
15. How can Power BI assist in optimizing inventory management for e-commerce businesses?
Inventory tracking in real-time:
- E-commerce companies may monitor inventory levels in real time with Power BI.
- Quick knowledge of stock availability aids in averting stockouts and overselling.
Forecasting demand:
- Power BI helps with product demand forecasts by using past data.
- Precise forecasting aids companies in preserving ideal stock levels by decreasing surplus inventory.
Analysis of Supplier Performance:
- Businesses can examine supplier performance metrics with Power BI.
- Finding trustworthy suppliers reduces supply chain interruptions and guarantees timely replenishment.
Identification of seasonal trends:
- Seasonal sales patterns can be found with the aid of Power BI's data visualisation.
- Businesses can optimise storage and cut expenses by adjusting inventory levels appropriately.
Optimising Order Fulfillment:
- Power BI offers information about order fulfilment and processing timeframes.
- Simplifying these procedures improves client loyalty and happiness.
Manufacturing and Supply Chain
16. Explain the use of Power BI in supply chain analytics.
Instantaneous Visibility:
- Stakeholders may track activities at every level of the supply chain using Power BI's real-time insights.
Forecasting demand:
- Power BI helps with precise demand forecasts by using historical data, which facilitates proactive decision-making and inventory management.
Optimising Inventory:
- The analytical features of Power BI aid in optimising inventory levels, avoiding stockouts or overstock, and lowering holding costs.
Analysis of Supplier Performance:
- Utilize Power BI to monitor supplier performance, taking into account costs, quality, and delivery times to make well-informed decisions.
Analysing Costs:
- Comprehensive cost analysis is made possible with Power BI, which helps to pinpoint areas in the supply chain where expenses can be cut and efficiency can be increased.
Risk Control:
- By illustrating possible supply chain interruptions, you may detect and reduce risks and use proactive risk management techniques.
Read more: Microsoft Power BI: Top features and advantages
In summary
Aspiring analysts are well-positioned to take advantage of the expanding opportunities in the data analytics industry if they have a solid understanding of Power BI and sophisticated interviewing techniques. Accept lifelong learning, keep yourself informed, and show off your enthusiasm for statistics in every interview.


Anshul Goyal
Group BDM at B M Infotrade | 11+ years Experience | Business Consultancy | Providing solutions in Cyber Security, Data Analytics, Cloud Computing, Digitization, Data and AI | IT Sales Leader